Categories
Life Style

Computationally restoring the potency of a clinical antibody against Omicron

[ad_1]

Antibody and antigen production

We experimentally validated the 376 designed candidates. To leverage available resources at multiple experimental sites, we split candidates into partially overlapping sets 1 and 2. Set 1 consisted of 230 designs expressed as IgG in HEK-293 cells (ATUM), and set 2 consisted of 204 designs expressed as IgG via a pVVC-mCisK_hG1 vector (Twist BioScience) in transiently transfected CHO cells. Omicron antigens were produced in Expi293F cells (Thermo Fisher Scientific) and purified on HisTrap Excel columns (Cytiva).

In the following experiments, we selected antigens or viral strains to gauge the success of three goals: (1) improving binding affinity and efficacy to BA.1 and BA.1.1; (2) maintaining efficacy to historical strains, for which design explicitly targeted Delta but experiments often substituted WA1/2020 D614G; and (3) determining robustness to emerging VOCs.

Designed antibodies maintain expression

Because in silico derivatization of antibody sequences can compromise production yield, we measured the concentrations of the 230 COV2-2130-derived recombinant antibodies in set 1 and compared these concentrations to that of the parental antibody. The purified concentrations of 73.9% of redesigned antibodies exceeded that of the parental COV2-2130 antibody (170 of 230 monoclonal antibodies at more than 171.2 mg l−1), reaching as high as 305 mg l−1. Our designed candidates for downstream characterization retained fundamental production properties of the parental antibody, with just 10% of designed antibodies producing poor yields relative to the parental molecule (22 of 230 monoclonal antibodies at less than 135 mg l−1, that is, less than 80% of the parental antibody yield).

Thermostability and binding Omicron

We screened all designed antibodies for binding to RBDs. Set 1 was screened via a single-concentration immunoassay (Gyrolab xPlore) in the contexts of WA1/2020, Delta, BA.1 or BA.1.1 RBDs (Extended Data Fig. 1). For set 2, we used a multi-concentration immunoassay (ELISA; Extended Data Fig. 2) in the context of wild-type, BA.1 or BA.1.1 RBDs. In the single-concentration immunoassay, this value was chosen as a single dilution factor, causing most designed antibody samples to fall in the dynamic range of the positive control. In both cases, we compared the binding of the designed antibodies with a broadly cross-reactive, non-ACE2-competitive control antibody (S309)24 and the parental COV2-2130 antibody. As intended, most antibody designs had altered binding profiles, indicating that the designed mutations were consequential. Approximately 11% of the designs of set 1 retained WA1/2020 antigen binding at the measured concentration; roughly 6% improved binding to BA.1, and 5% did so to BA.1.1. The corresponding numbers for set 2 were 9% to WA1/2020 and 8% to BA.1. Following this initial screen, we downselected both sets of antibody designs to those with improved binding to Omicron subvariants BA.1 and BA.1.1 for further characterization.

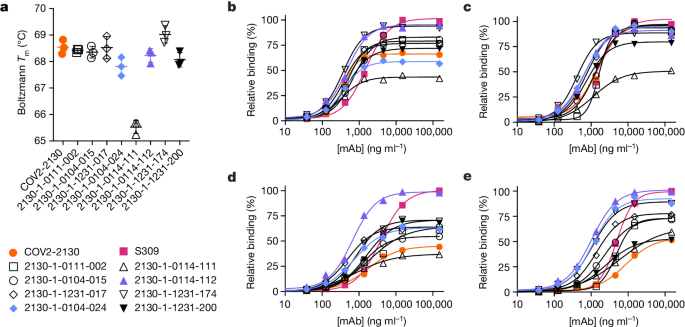
These downselected antibodies were re-manufactured at larger scale. We characterized the resulting IgG antibodies by immunoassay and thermal shift (melt temperature) assessments. In agreement with our screens, seven of the eight top-performing antibodies preserved comparable binding with WA1/2020 and Delta RBDs, improving over the parental COV2-2130 antibody with respect to their binding to Omicron BA.1 and BA.1.1 RBDs (Fig. 2). Furthermore, seven of the eight antibodies had melting temperatures and expression properties comparable with those of COV2-2130. One antibody, 2130-1-0114-111, had reduced melting temperature (Extended Data Table 1). The antibody 2130-1-0114-112 displayed best-in-class binding across all RBD variants and had no substantial difference in thermal stability compared with the parental COV2-2130 antibody.

Fig. 2: Computationally designed IgG antibodies improve Omicron binding and maintain parental thermostability and binding to historical strains.
figure 2

a, The parental COV2-2130 (orange circles) and computationally designed antibodies (2130-1-0114-112 in purple triangles, 2130-1-0104-024 in blue diamonds and remainder in black) were assayed for thermal shift (n = 3 technical replicates). Melting temperature (Tm ) calculated based on the Boltzmann method. Data are mean and s.d. be, The parental COV2-2130 antibody and computationally designed antibodies (see symbols in a) and cross-reactive positive control antibody S309 (magenta squares) were analysed for relative binding to four SARS-CoV-2 spike RBD variants in the Gyrolab immunoassay: WA1/2020 (b), Delta B.1.617.2 (c), Omicron BA.1 (d) and Omicron BA.1.1 (e). Lines represent a four-parameter logistic regression model fit using GraphPad Prism to each titration, executed without technical replicates. mAb, monoclonal antibody.

Restored pseudoviral neutralization

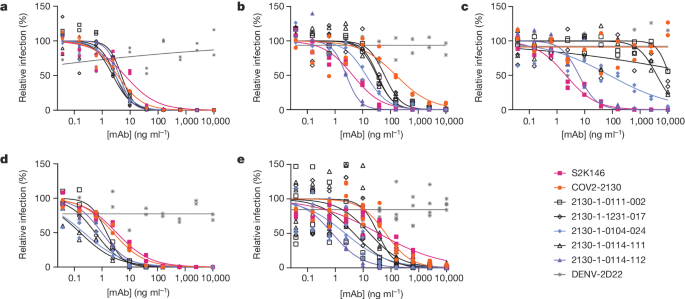
We performed pseudovirus neutralization assays to characterize the functional performance of five selected antibody designs (Fig. 3 and Extended Data Table 2), compared with parental COV2-2130; the positive control S2K146 (ref. 25), which competes with ACE2 binding; and the negative control DENV-2D22 (ref. 26). Our designs maintained neutralization activity against pseudoviruses displaying historical spike proteins (WA1/2020 D614G) and achieved neutralization of those with Omicron BA.1 spikes. The single-best candidate design, 2130-1-0114-112, restored potent neutralization in the context of BA.1.1 and showed a two-order-of-magnitude improvement in the half-maximal inhibitory concentration (IC50) versus parental COV2-2130 for BA.1 and BA.4. These pseudovirus neutralization test results showed that our designs neutralized BA.2 and BA.4 more potently than COV2-2130, despite the emergence of these VOCs after the conception of our designs.

Fig. 3: Designed antibodies improve pseudoviral neutralization over COV2-2130.
figure 3

ae, The parental COV2-2130 antibody (orange circles), the cross-reactive positive control antibody S2K146 (magenta squares), the negative control antibody DENV-2D22 (grey x) and down-selected computationally designed antibodies (symbols as indicated in the key) were assayed by neutralization with lentiviruses pseudotyped with spike variants of WA1/2020 D614G (a), Omicron BA.1 (b), Omicron BA.1.1 (c), Omicron BA.2 (d) and Omicron BA.4 (e). Curves are four-parameter logistic regression models fit to two (ad) or four (e) replicate serial dilutions using GraphPad Prism.

Restored authentic virus neutralization

We evaluated 2130-1-0114-112 (containing four mutations: GH112E, SL32A, SL33A and TL59E) for authentic virus neutralization performance against several strains of SARS-CoV-2 by a focus reduction neutralization test in Vero-TMPRSS2 cells (Extended Data Fig. 3). The strains that we used included several Omicron targets: WA1/2020 D614G, Delta (B.1.617.2), BA.1, BA.1.1, BA.2, BA.2.12.1, BA.4, BA.5 and BA.5.5. In all cases apart from Delta, 2130-1-0114-112 had an IC50 < 10 ng ml−1. Compared with the parental COV2-2130, 2130-1-0114-112 restored potent neutralization activity to both BA.1 (8.08 ng ml−1) and BA.1.1 (7.77 ng ml−1), showed a more than fivefold improvement in IC50 to BA.2 (2.4 ng ml−1) and BA.2.12.1 (2.27 ng ml−1), and conferred 50-fold or greater improvements in IC50 to BA.4 (3.16 ng ml−1), BA.5 (3.51 ng ml−1) and BA.5.5 (5.29 ng ml−1). We also evaluated 2130-1-0114-112 and a less-mutated alternative design, 2130-1-0104-024 (containing two mutations: SL32W and TL59E), in plaque assays with Vero E6-TMPRSS2-T2A-ACE2 cells (Extended Data Fig. 4). IC50 values for 2130-1-0104-024 were 37.7 ng ml−1, 75.94 ng ml−1 and 781.7 ng ml−1 for Delta, BA.1 and BA.1.1 viruses, respectively.

Prophylaxis in vivo

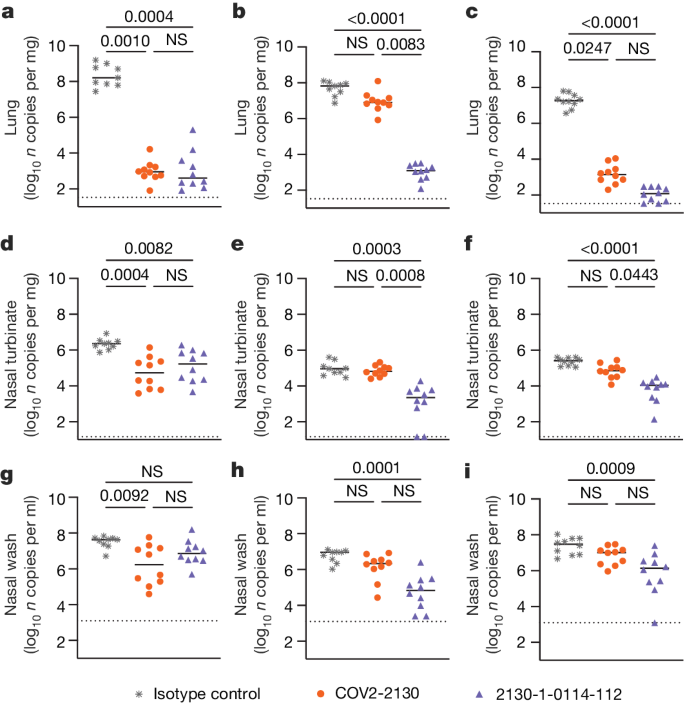
To compare the prophylactic efficacy of 2130-1-0114-112 and the parental COV2-2130 monoclonal antibody in vivo, we administered a single 100 μg (approximately 5 mg kg−1 total) dose to K18-hACE2 transgenic mice 1 day before intranasal inoculation with WA1/2020 D614G, BA.1.1 or BA.5 (88 mice in total, 9–10 for each monoclonal antibody and viral strain). Although Omicron viruses are less pathogenic in mice than in humans, they replicate efficiently in the lungs of K18-hACE2 mice27,28. Viral RNA levels were measured at 4 days post-infection in the nasal washes, nasal turbinates and lungs (Fig. 4). As expected, the parental COV2-2130 monoclonal antibody effectively reduced WA1/2020 D614G infection in the lungs (180,930-fold), nasal turbinates (42-fold) and nasal washes (25-fold) compared with the isotype control monoclonal antibody. However, the COV2-2130 monoclonal antibody lost protective activity to BA.1.1 in all respiratory tract tissues, whereas to BA.5, protection was maintained in the lungs (13,622-fold) but not in the nasal turbinates or nasal washes. Compared with the isotype control monoclonal antibody (Fig. 4), 2130-1-0114-112 protected against lung infection by WA1/2020 D614G (399,945-fold reduction), BA.1.1 (53,468-fold reduction) and BA.5 (160,133-fold reduction). Moreover, in the upper respiratory tract, 2130-1-0114-112 also conferred protection to WA1/2020 D614G, BA.1.1 and BA.5. The differences in protection between the parental COV2-2130 and derivative 2130-1-0114-112 monoclonal antibodies were most apparent in mice infected with BA.1.1, which directly parallels the neutralization data (Fig. 3 and Extended Data Figs. 3 and 4).

Fig. 4: 2130-1-0114-112 provides in vivo prophylactic protection against SARS-CoV-2 variants.
figure 4

ai, Eight-week-old female K18-hACE2 mice were administered 100 μg (approximately 5 mg kg−1) of the indicated monoclonal antibody treatment by intraperitoneal injection 1 day before intranasal inoculation with 104 focus-forming units (FFU) of WA1/2020 D614G (a,d,g), Omicron BA.1.1 (b,e,h) or Omicron BA.5 (c,f,i). Tissues were collected 4 days after inoculation. Viral RNA levels in the lungs (ac), nasal turbinates (df) and nasal washes (gi) were determined by RT–qPCR (lines indicate median of log10 values); n  =  9 (WA1/2020 D614G and BA.1.1 isotype control groups) or 10 (all others) mice per group, from two experiments. The limit of assay detection is shown as a horizontal dotted line. Statistical comparisons between groups were by Kruskal–Wallis ANOVA with Dunn’s multiple comparisons post-test; P values are as listed or not significant (NS) if P > 0.05. All analyses were conducted in GraphPad Prism.

Source data

Potency without additional liabilities

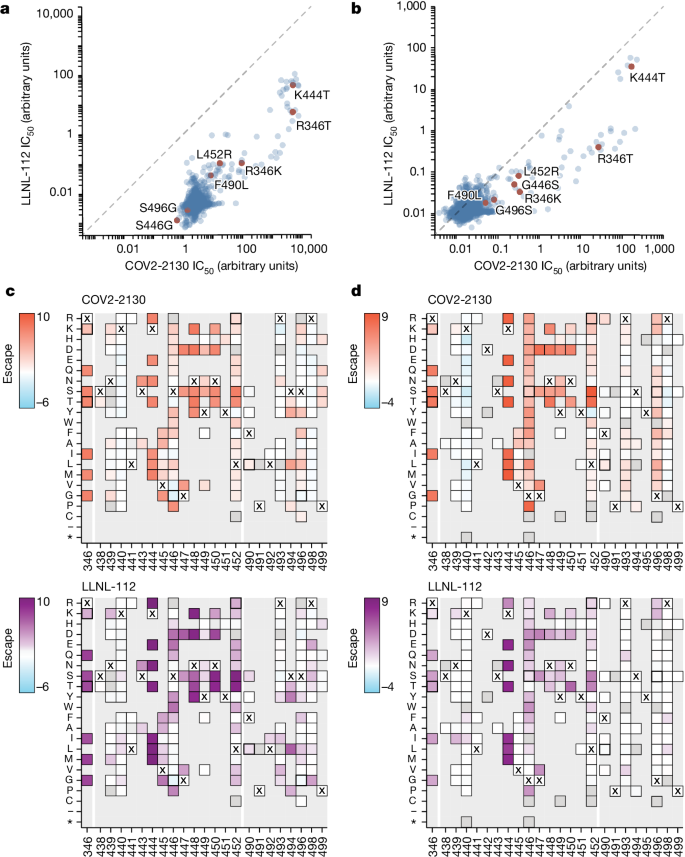
To understand the neutralization breadth of 2130-1-0114-112 relative to its ancestral antibody, we mapped the epitopes for both antibodies using spike-pseudotyped lentiviral deep mutational scanning (DMS)29. For each antibody, we mapped escape mutations in both the BA.1 and the BA.2 spikes. DMS experiments showed that the escape profile of both COV2-2130 and 2130-1-0114-112 in the context of both BA.1 and BA.2 backgrounds is consistent with the epitope of the antibodies, but with differences in sensitivity to particular mutations (Fig. 5). Consistent with live and pseudovirus neutralization assays (Fig. 3 and Extended Data Figs. 3 and 4), mutations at RBD positions R346 and L452 are sites of substantial escape from both antibodies (Fig. 5). In addition, both antibodies lose potency with mutations at site K444 (such as K444T found in BQ.1* variants). The reversion mutation S446G in the BA.1 background increases the neutralization potency of both antibodies (negative escape values in heatmaps) (Fig. 5c) and probably contributes to greater neutralization potency to the BA.2 variant (Fig. 3 and Extended Data Fig. 3), which carries G446. Most mutations at RBD sites K440 and R498 are slightly sensitizing to the COV2-2130 antibody in both BA.1 and BA.2 backgrounds, but provide weak escape for 2130-1-0114-112 in the BA.1 background and have even weaker effect in the BA.2 background. In agreement with pseudovirus neutralization assays (Fig. 3), comparison of mutation-level escape showed that the 2130-1-0114-112 antibody is substantially more potent than COV2-2130 to the BA.1 variant and retains better potency against viruses with additional mutations in both BA.1 and BA.2 backgrounds (Fig. 5a,b). However, even with improved potency, 2130-1-0114-112 is still vulnerable to escape at multiple RBD residues in the 444–452 loop, which is the site of convergent substitutions in several Omicron lineages30. Many of these variants contain multiple substitutions at positions identified by DMS as important for neutralization or in close proximity to the COV2-2130 epitope, including BQ.1.1 (R346T and K444T), XBB (R346T, V445P and G446S) and BN.1 (R346T, K356T and G446S). To understand the impact of these VOCs, we assessed the ability of 2130-1-0114-112 to neutralize BQ.1.1, XBB and BN.1 in pseudoviral neutralization studies. Consistent with the previously known liabilities of COV2-2130 and our DMS results, 2130-1-0114-112 loses neutralizing activity to these VOCs (Extended Data Fig. 5), probably due to substitutions at 444 and combinatorial effects of multiple substitutions within the COV2-2130 epitope present in these variants. Together, these data demonstrate that 2130-1-0114-112 exhibits improved potency against many individual substitutions without incurring additional escape liabilities, although RBD residues such as 444 remain critical for neutralization activity of both 2130-1-0144-112 and COV2-2130.

Fig. 5: COV-2130 and 2130-1-0114-112 escape mapping using DMS.
figure 5

a,b, Comparison between IC50 values measured using DMS for COV-2130 and 2130-1-0114-112 antibodies in BA.1 (a) and BA.2 (b) backgrounds, with key mutations highlighted. Arbitrary units in both plots are on the same scale. Interactive plots that display each mutation can be found at https://dms-vep.org/SARS-CoV-2_Omicron_BA.1_spike_DMS_COV2-2130/compare_IC50s.html for the BA.1 background and at https://dms-vep.org/SARS-CoV-2_Omicron_BA.2_spike_DMS_COV2-2130/compare_IC50s.html for the BA.2 background. c,d, Heatmaps of mutation escape scores at key sites for each antibody in BA.1 (c) and BA.2 (d) backgrounds. Escape scores were calculated relative to the wild-type amino acid in the same virus background. X marks wild-type amino acid in the relevant background. Amino acids not present in the DMS libraries lack squares; grey squares are mutations that strongly impair spike-mediated infection. Mutations identified in a,b are shown with a heavy line surrounding the corresponding box in c,d. Interactive heatmaps for full spike can be found for the BA.1 background at https://dms-vep.org/SARS-CoV-2_Omicron_BA.1_spike_DMS_COV2-2130/COV2-2130_vs_2130-1-0114-112_escape.html and https://dms-vep.org/SARS-CoV-2_Omicron_BA.2_spike_DMS_COV2-2130/COV2-2130_vs_2130-1-0114-112_escape.html for the BA.2 background.

Structural basis for restored potency

To elucidate the key intermolecular interactions that form the interface and determine Omicron RBD recognition by 2130-1-0114-112, we performed 3D reconstructions of the complex between the SARS-CoV-2 Omicron BA.2 spike and the 2130-1-0114-112 Fab fragment using cryo-electron microscopy (cryo-EM). Reconstruction using refinement of the full complex gave a map with average resolution of 3.26 Å, but the interface region between the BA.2 RBD and the 2130-1-0114-112 Fab was not well resolved, presumably due to the flexibility of the RBD–Fab region in the reconstruction. To resolve details at the intermolecular interface, we performed focused refinement of this portion of the structure. Focused refinement resulted in an effective resolution of approximately 3.6 Å for this region (Electron Microscopy Data Bank EMD-28198 and EMD-28199, and Protein Data Bank 8EKD) (Fig. 6 and Extended Data Fig. 6).

Fig. 6: Cryo-EM structure of neutralizing antibodies 2130-1-0114-112 in complex with Omicron BA.2 RBD.
figure 6

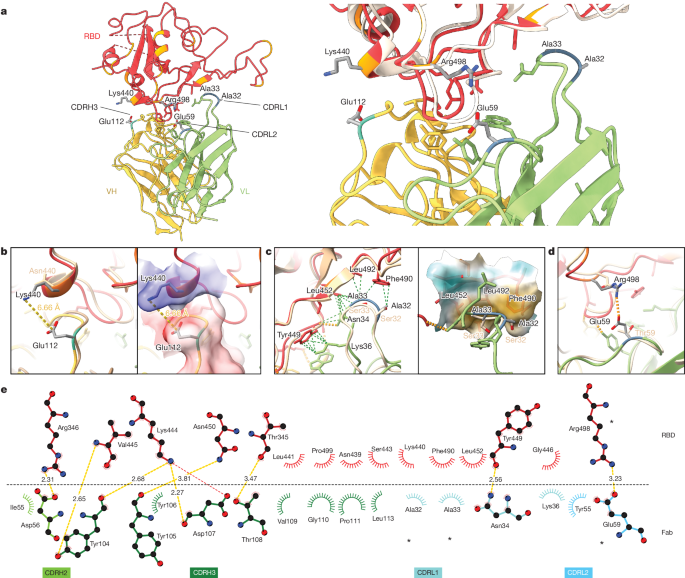
a, Atomic model of the RBD–Fab complex, coloured by chain: BA.2 RBD in red, 2130-1-0114-112 HC in yellow and 2130-1-0114-112 LC in green. BA.2 RBD mutations are in orange, and 2130-1-0114-112 mutations are in cyan and blue (HC and LC) (left). A close-up view of the RBD–Fab interface, showing WA1 RBD (Protein Data Bank 7L7E, light brown shading) aligned with the BA.2 RBD (right). bd, Details showing the 2130-1-0114-112 modified residues and their interaction with BA.2 RBD, coloured as in a. Residue labels are shown in black for the BA.2 complex and brown for the overlaid WA1-2130 complex. The orange and green dashed lines indicate hydrogen bond and hydrophobic interactions, respectively; the yellow dashed lines are labelled with distances. CDRH3 residue Glu112 (left) and with the surface coloured by electrostatic potential (right), showing the positive and negative charges of RBD Lys444 and CDRH3 Glu112 (b). CDRL1 Ala32 and Ala33 hydrophobic network (left) and with the nearby RBD surface coloured by hydrophobicity (right; orange to cyan indicates hydrophobic to hydrophilic) (c). CDRL2 Glu59 salt bridge with RBD residue Arg498 (d). e, 2D diagram of Fab 2130-1-0114-112 paratope and epitope residues involved in hydrogen bonds and salt bridges (yellow and red dashed lines, respectively; distances in Å) and hydrophobic interactions (curved lines with rays). Atoms are shown as circles, with oxygen, carbon and nitrogen in red, black and blue, respectively. Interacting residues that belong to CDR loops are coloured in corresponding shades. The asterisks indicate mutated residues. Image created with Ligplot+34.

This model shows the binding interface of 2130-1-0114-112–RBD and elucidates how 2130-1-0114-112 regains neutralization potency to Omicron VOCs. The parental COV2-2130 forms extensive interactions with the RBD through CDRH2 and CDRH3, as well as CDRL1 and CDRL2 (ref. 13) with hydrogen bond networks and hydrophobic interactions. To improve binding interactions with Omicron subvariants, 2130-1-0114-112 modifies three CDR loops: G112E in CDRH3, S32A and S33A in CDRL1, and T59E in CDRL2.

The RBD N440K substitution, identified in the DMS as sensitizing for escape from COV2-2130 but less so for 2130-1-0114-112, is on the edge of the interface with the 2130-1-0114-112 CDRH3 loop and does not make direct contact with the CDRH3 substitution G112E. However, N440K introduces a positive charge to a local environment that has substantial hydrophobic-to-hydrophobic contact. The negative charge introduced by the CDRH3 G112E substitution (Fig. 6b) might improve the electrostatic interactions in this region. It is possible that E112 and K440 are interacting by coordinating a water molecule, but the structural resolution is not sufficient to confirm this type of interaction. These experimental structural results are also consistent with our molecular dynamics simulations, which showed this transient interaction between CDRH3 E112 and RBD K440.

The local environment around the CDRL1 loop is mostly hydrophobic (comprising the RBD residues L452, F490 and L492, as well as the Omicron mutation E484A) with a hydrogen bond from LC N34 (Fig. 6c). The hydrophilic-to-hydrophobic CDRL1 substitutions introduced in 2130-1-0114-112, S32A and S33A, may favour the local environment and strengthen hydrophobic interactions with the RBD (Fig. 6c,e). This is supported by the DMS identification of sensitivity to hydrophobic-to-hydrophilic substitutions at RBD position 452 for both 1230-1-0114-112 and the parental COV2-2130. Finally, the T59E mutation in the CDRL2 loop establishes a new salt bridge with the RBD substitution Q498R present in Omicron RBDs. This new salt bridge probably strengthens the interaction with the RBD (Fig. 6d,e).

2130-1-0114-112 distributes four substitutions across three of the four CDR loops comprising the parental COV2-2130 paratope. Mutations to CDRH3 loop were less fruitful than mutations in the L1 and L2 (Extended Data Fig. 7a compared with Extended Data Fig. 7d) when looking across all antibody candidates. Among successful candidates, substitutions at positions 32 and 33 in CDRL1 appear enriched—particularly with hydrophobic residues—consistent with our analysis of this region of the experimentally solved structure of 2130-1-0114-112–BA.2 spike. Another candidate, 2130-1-0104-024, achieves improved affinity and neutralization with only two substitutions: S32W in CDRL1 and T59E in CDRL2. However, full neutralization potency is not reached without the potential charge accommodation mediated by G112E. This suggests that a combination of new bonds and accommodating charge changes optimized the restored affinity and potency of 2130-1-0114-112 with Omicron variants (Extended Data Fig. 8). Altogether, the structural model of 2130-1-0114-112 with the BA.2 RBD helps explain the observed restoration of potency to early SARS-CoV-2 Omicron VOCs.

[ad_2]

Source Article Link

Categories
Life Style

electrochemist whose techniques underpin clinical diagnostics, materials discovery and more

[ad_1]

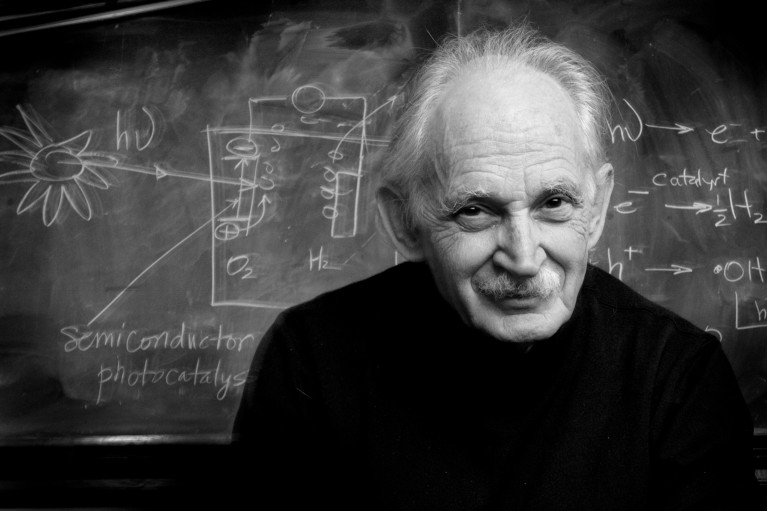
Black and white portrait of Professor Allen J. Bard in front of a blackboard

Credit: The University of Texas at Austin

Allen Bard is widely regarded as the father of modern electrochemistry. During his prolific research career, including more than 60 years at the University of Texas (UT) at Austin, Bard became a world-renowned innovator and researcher, pioneering diverse areas of electrochemistry and technologies that are widely used today.

Bard’s work on electrochemiluminescence — luminescence induced by a reaction involving the transfer of electrons — led to the commercialization of sensitive assays for biomarkers in clinical diagnostics. Bard also developed the first scanning electrochemical microscope, a tool that has proved invaluable for investigating materials for solar cells and batteries, as well as for probing cancer cells and tracking chemical reactions.

Born and raised in New York City, Bard studied chemistry at the City College of New York in 1955. He did his graduate studies (1955–58) at Harvard University in Cambridge, Massachusetts, briefly under Nobel laureate Geoffrey Wilkinson, who specialized in organometallic compounds. Bard’s presence in Wilkinson’s laboratory when the group identified the structure of ferrocene — the most ubiquitous electrochemical standard in electrochemistry — was a harbinger of great things to come.

After Wilkinson left Harvard in 1955, Bard moved to James J. Lingane’s research group, where he completed his dissertation on the electrochemistry of tin. He also worked with chemist David Geske on early attempts to apply electrochemical methods to the study of reaction mechanisms. He was introduced to the electrochemistry of aprotic solvents (unlike water, they lack an acidic proton), in which highly reactive species can be generated that would otherwise be quenched by reactions with protons.

Bard was subsequently hired as an instructor at UT Austin by Norman Hackerman, a chemist who specialized in electrochemical measurements of corrosion. In the 1960s, Bard and others established the important role of radical ions (ions that have an extra electron) in oxidation and reduction reactions of organic compounds. His group demonstrated that these species resulted from transfers of a single electron, a concept that was not generally accepted at the time. This work led Bard’s research into the area of electrogenerated chemiluminescence — in which species generated at electrodes form excited states that emit light.

Bard was a continual pioneer and rapid adapter of new electrochemical techniques. He developed many different approaches, including the rotating ring-disk electrode, used in hydrogen generation; alternating-current impedance methods for measuring fast electron transfer; and the use of digital simulations for analysing electrochemical processes. These methods provided fundamental insights into how electrons move (as a current) across interfaces and into solution as the electric potential (voltage) is varied.

From 1979 to the end of the 1990s, Bard developed the microscopic detection of electrochemical processes using piezoelectric motors, work that ultimately resulted in the development of scanning electrochemical microscopy. This technique can image electrochemical reactions on surfaces at scales from micrometres to nanometres. In collaboration with chemist Fu-Ren ‘Frank’ Fan, Bard used this form of microscopy to conduct the first electrochemical measurement of a single redox molecule, which for analytical chemists is the ultimate achievement at the limit of detection.

Bard’s interests didn’t stop there. During the global oil crises of the 1970s, he was a pioneer of solar fuels — chemical energy sources produced using sunlight and stored for later use. He adapted the physics and materials science of metal–semiconductor junctions, or Schottky barriers, and applied electrochemical methods to split water molecules to release hydrogen, for example.

In the late 1970s, Bard’s group brought its techniques to the study of proteins and other biological molecules, including for processes such as the measurement of the electrochemical reduction of disulfide bonds in insulin and bovine serum albumin. This demonstrated the viability of protein electrochemistry, and such methods have since been used to study the movement of electrons in biological systems such as photosystem II and the fungal enzyme laccase in biofuel cells.

In 1980, Bard and his former PhD student Larry Faulkner penned the seminal textbook Electrochemical Methods, which will continue to inform generations of electrochemists. The latest, 3rd edition contains contributions from one of us (H.S.W.). Bard served as editor-in-chief of the Journal of the American Chemical Society from 1982 to 2001.

Bard was of the ‘old school’ of researchers and was dedicated to deep fundamental investigations of select topics. Nonetheless, he was always on the lookout for new ideas, asking colleagues: “What’s the new science here?” He prized innovation, thoroughness and independent thought.

His vast and lasting academic legacy includes more than 1,000 research papers and more than 30 patents. Perhaps the greatest legacy lies in the people that Bard worked with and mentored. Over his almost 65 years at UT Austin, Bard supervised some 90 PhD students and collaborated with around 200 postdoctoral associates and many visiting scientists.

In 2002, on his receipt of the Priestley Award — the highest award of the American Chemical Society — Bard told Chemical Engineering News: “Whatever I’ve done as a scientist will be there for a while, but then fade away. The big names in science quickly become unknown. But through your students you maintain a presence in future generations, and they go on and on and on.” In this regard, Bard’s work is enshrined in the chemistry community, scientific literature and history books.

Competing Interests

The authors declare no competing interests.

[ad_2]

Source Article Link

Categories
Life Style

How AI is being used to accelerate clinical trials

[ad_1]

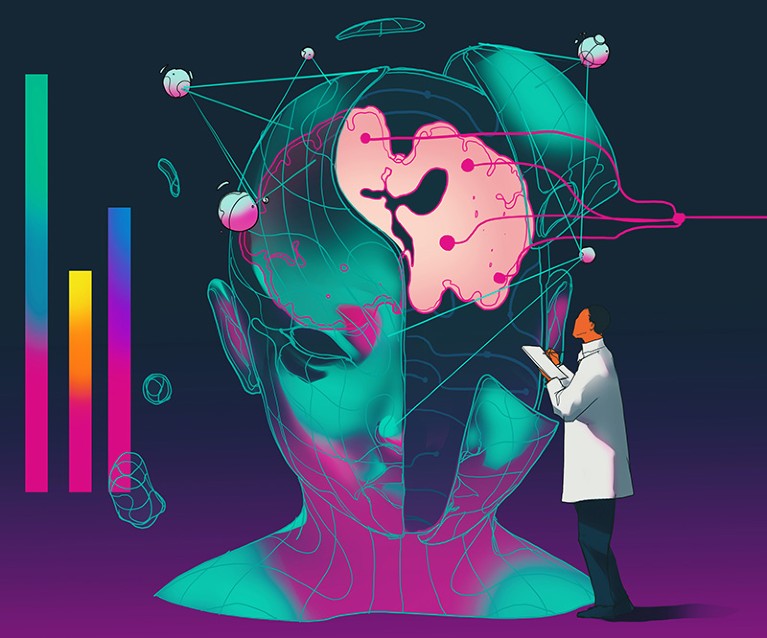
At the right of the image an illustrated figure holding clipboard looks at abstract depiction of head with brain visible. Three multicoloured vertical bars to left of image.

Credit: Taj Francis

For decades, computing power followed Moore’s law, advancing at a predictable pace. The number of components on an integrated circuit doubled roughly every two years. In 2012, researchers coined the term Eroom’s law (Moore spelled backwards) to describe the contrasting path of drug development1. Over the previous 60 years, the number of drugs approved in the United States per billion dollars in R&D spending had halved every nine years. It can now take more than a billion dollars in funding and a decade of work to bring one new medication to market. Half of that time and money is spent on clinical trials, which are growing larger and more complex. And only one in seven drugs that enters phase I trials is eventually approved.

Some researchers are hoping that the fruits of Moore’s law can help to curtail Eroom’s law. Artificial intelligence (AI) has already been used to make strong inroads into the early stages of drug discovery, assisting in the search for suitable disease targets and new molecule designs. Now scientists are starting to use AI to manage clinical trials, including the tasks of writing protocols, recruiting patients and analysing data.

Reforming clinical research is “a big topic of interest in the industry”, says Lisa Moneymaker, the chief technology officer and chief product officer at Saama, a software company in Campbell, California, that uses AI to help organizations automate parts of clinical trials. “In terms of applications,” she says, “it’s like a kid in a candy store.”

Trial by design

The first step of the clinical-trials process is trial design. What dosages of drugs should be given? To how many patients? What data should be collected on them? The lab of Jimeng Sun, a computer scientist at the University of Illinois Urbana-Champaign, developed an algorithm called HINT (hierarchical interaction network) that can predict whether a trial will succeed, based on the drug molecule, target disease and patient eligibility criteria. They followed up with a system called SPOT (sequential predictive modelling of clinical trial outcome) that additionally takes into account when the trials in its training data took place and weighs more recent trials more heavily. Based on the predicted outcome, pharmaceutical companies might decide to alter a trial design, or try a different drug completely.

A company called Intelligent Medical Objects in Rosemont, Illinois, has developed SEETrials, a method for prompting OpenAI’s large language model GPT-4 to extract safety and efficacy information from the abstracts of clinical trials. This enables trial designers to quickly see how other researchers have designed trials and what the outcomes have been. The lab of Michael Snyder, a geneticist at Stanford University in California, developed a tool last year called CliniDigest that simultaneously summarizes dozens of records from ClinicalTrials.gov, the main US registry for medical trials, adding references to the unified summary. They’ve used it to summarize how clinical researchers are using wearables such as smartwatches, sleep trackers and glucose monitors to gather patient data. “I’ve had conversations with plenty of practitioners who see wearables’ potential in trials, but do not know how to use them for highest impact,” says Alexander Rosenberg Johansen, a computer-science student in Snyder’s lab. “Best practice does not exist yet, as the field is moving so fast.”

Most eligible

The most time-consuming part of a clinical trial is recruiting patients, taking up to one-third of the study length. One in five trials don’t even recruit the required number of people, and nearly all trials exceed the expected recruitment timelines. Some researchers would like to accelerate the process by relaxing some of the eligibility criteria while maintaining safety. A group at Stanford led by James Zou, a biomedical data scientist, developed a system called Trial Pathfinder that analyses a set of completed clinical trials and assesses how adjusting the criteria for participation — such as thresholds for blood pressure and lymphocyte counts — affects hazard ratios, or rates of negative incidents such as serious illness or death among patients. In one study2, they applied it to drug trials for a type of lung cancer. They found that adjusting the criteria as suggested by Trial Pathfinder would have doubled the number of eligible patients without increasing the hazard ratio. The study showed that the system also worked for other types of cancer and actually reduced harmful outcomes because it made sicker people — who had more to gain from the drugs — eligible for treatment.

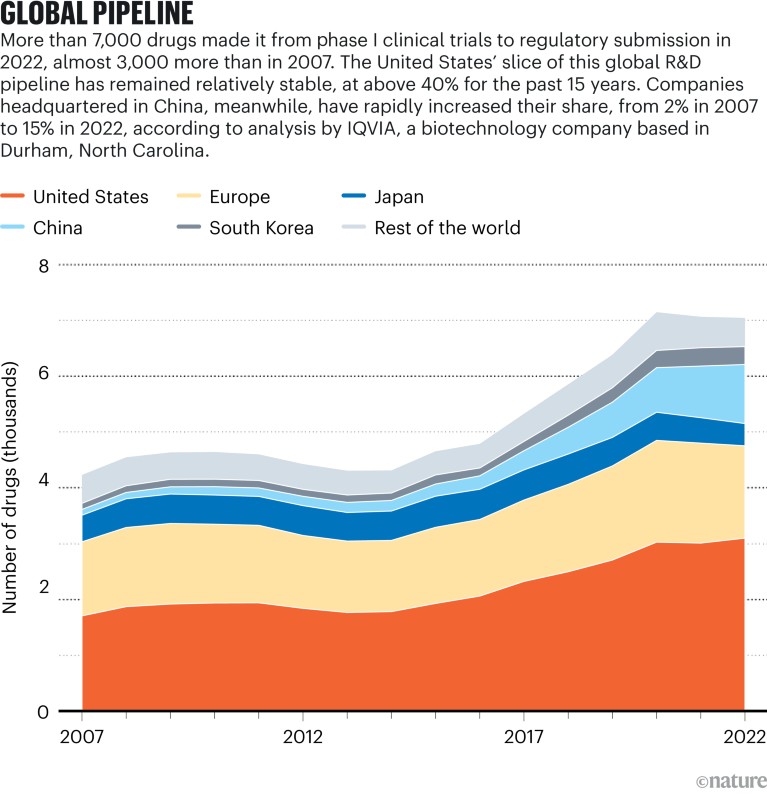
Area chart showing the number of drugs developed by companies based in six selected countries that made from phase I clinical trials to regulatory submission in 2007 to 2022

Sources: IQVIA Pipeline Intelligence (Dec. 2022)/IQVIA Institute (Jan. 2023)

AI can eliminate some of the guesswork and manual labour from optimizing eligibility criteria. Zou says that sometimes even teams working at the same company and studying the same disease can come up with different criteria for a trial. But now several firms, including Roche, Genentech and AstraZeneca, are using Trial Pathfinder. More recent work from Sun’s lab in Illinois has produced AutoTrial, a method for training a large language model so that a user can provide a trial description and ask it to generate an appropriate criterion range for, say, body mass index.

Once researchers have settled on eligibility criteria, they must find eligible patients. The lab of Chunhua Weng, a biomedical informatician at Columbia University in New York City (who has also worked on optimizing eligibility criteria), has developed Criteria2Query. Through a web-based interface, users can type inclusion and exclusion criteria in natural language, or enter a trial’s identification number, and the program turns the eligibility criteria into a formal database query to find matching candidates in patient databases.

Weng has also developed methods to help patients look for trials. One system, called DQueST, has two parts. The first uses Criteria2Query to extract criteria from trial descriptions. The second part generates relevant questions for patients to help narrow down their search. Another system, TrialGPT, from Sun’s lab in collaboration with the US National Institutes of Health, is a method for prompting a large language model to find appropriate trials for a patient. Given a description of a patient and clinical trial, it first decides whether the patient fits each criterion in a trial and offers an explanation. It then aggregates these assessments into a trial-level score. It does this for many trials and ranks them for the patient.

Helping researchers and patients find each other doesn’t just speed up clinical research. It also makes it more robust. Often trials unnecessarily exclude populations such as children, the elderly or people who are pregnant, but AI can find ways to include them. People with terminal cancer and those with rare diseases have an especially hard time finding trials to join. “These patients sometimes do more work than clinicians in diligently searching for trial opportunities,” Weng says. AI can help match them with relevant projects.

AI can also reduce the number of patients needed for a trial. A start-up called Unlearn in San Francisco, California, creates digital twins of patients in clinical trials. Based on an experimental patient’s data at the start of a trial, researchers can use the twin to predict how the same patient would have progressed in the control group and compare outcomes. This method typically reduces the number of control patients needed by between 20% and 50%, says Charles Fisher, Unlearn’s founder and chief executive. The company works with a number of small and large pharmaceutical companies. Fisher says digital twins benefit not only researchers, but also patients who enrol in trials, because they have a lower chance of receiving the placebo.

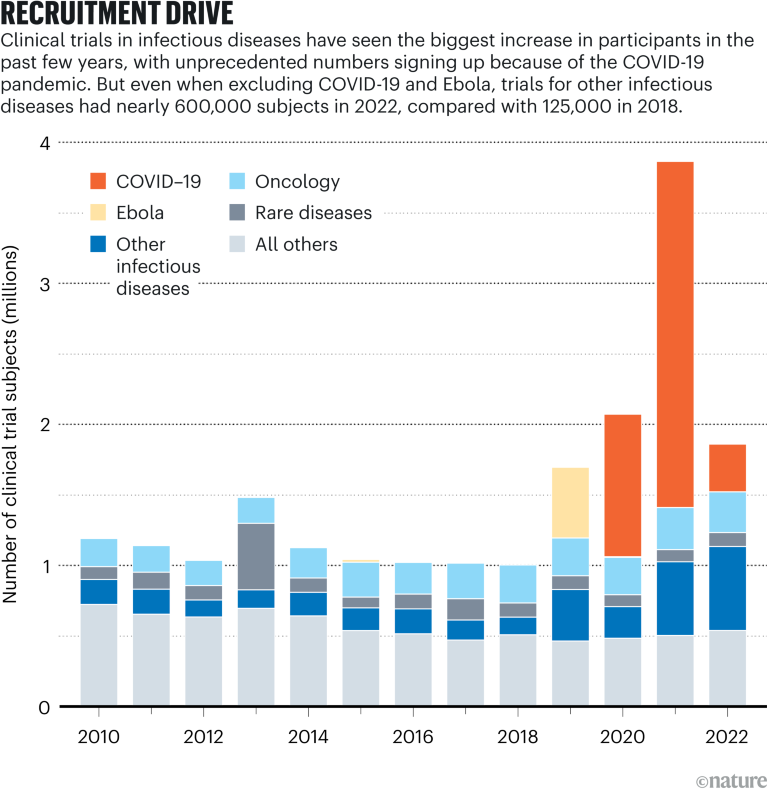
Bar chart showing the number of clinical trial subjects by disease type for 2010 to 2022

Source: Citeline Trialtrove/IQVIA Institute (Jan. 2023)

Patient maintenance

The hurdles in clinical trials don’t end once patients enrol. Drop-out rates are high. In one analysis of 95 clinical trials, nearly 40% of patients stopped taking the prescribed medication in the first year. In a recent review article3, researchers at Novartis mentioned ways that AI can help. These include using past data to predict who is most likely to drop out so that clinicians can intervene, or using AI to analyse videos of patients taking their medication to ensure that doses are not missed.

Chatbots can answer patients’ questions, whether during a study or in normal clinical practice. One study4 took questions and answers from Reddit’s AskDocs forum and gave the questions to ChatGPT. Health-care professionals preferred ChatGPT’s answers to the doctors’ answers nearly 80% of the time. In another study5, researchers created a tool called ChatDoctor by fine-tuning a large language model (Meta’s LLaMA-7B) on patient-doctor dialogues and giving it real-time access to online sources. ChatDoctor could answer questions about medical information that was more recent than ChatGPT’s training data.

Putting it together

AI can help researchers manage incoming clinical-trial data. The Novartis researchers reported that it can extract data from unstructured reports, as well as annotate images or lab results, add missing data points (by predicting values in results) and identify subgroups among a population that responds uniquely to a treatment. Zou’s group at Stanford has developed PLIP, an AI-powered search engine that lets users find relevant text or images within large medical documents. Zou says they’ve been talking with pharmaceutical companies that want to use it to organize all of the data that comes in from clinical trials, including notes and pathology photos. A patient’s data might exist in different formats, scattered across different databases. Zou says they’ve also done work with insurance companies, developing a language model to extract billing codes from medical records, and that such techniques could also extract important clinical trial data from reports such as recovery outcomes, symptoms, side effects and adverse incidents.

To collect data for a trial, researchers sometimes have to produce more than 50 case report forms. A company in China called Taimei Technology is using AI to generate these automatically based on a trial’s protocol.

A few companies are developing platforms that integrate many of these AI approaches into one system. Xiaoyan Wang, who heads the life-science department at Intelligent Medical Objects, co-developed AutoCriteria, a method for prompting a large language model to extract eligibility requirements from clinical trial descriptions and format them into a table. This informs other AI modules in their software suite, such as those that find ideal trial sites, optimize eligibility criteria and predict trial outcomes. Soon, Wang says, the company will offer ChatTrial, a chatbot that lets researchers ask about trials in the system’s database, or what would happen if a hypothetical trial were adjusted in a certain way.

The company also helps pharmaceutical firms to prepare clinical-trial reports for submission to the US Food and Drug Administration (FDA), the organization that gives final approval for a drug’s use in the United States. What the company calls its Intelligent Systematic Literature Review extracts data from comparison trials. Another tool searches social media for what people are saying about diseases and drugs in order to demonstrate unmet needs in communities, especially those that feel underserved. Researchers can add this information to reports.

Zifeng Wang, a student in Sun’s lab, in Illinois, says he’s raising money with Sun and another co-founder, Benjamin Danek, for a start-up called Keiji AI. A product called TrialMind will offer a chatbot to answer questions about trial design, similar to Xiaoyan Wang’s. It will do things that might normally require a team of data scientists, such as write code to analyse data or produce visualizations. “There are a lot of opportunities” for AI in clinical trials, he says, “especially with the recent rise of larger language models.”

At the start of the pandemic, Saama worked with Pfizer on its COVID-19 vaccine trial. Using Saama’s AI-enabled technology, SDQ, they ‘cleaned’ data from more than 30,000 patients in a short time span. “It was the perfect use case to really push forward what AI could bring to the space,” Moneymaker says. The tool flags anomalous or duplicate data, using several kinds of machine-learning approaches. Whereas experts might need two months to manually discover any issues with a data set, such software can do it in less than two days.

Other tools developed by Saama can predict when trials will hit certain milestones or lower drop-out rates by predicting which patients will need a nudge. Its tools can also combine all the data from a patient — such as lab tests, stats from wearable devices and notes — to assess outcomes. “The complexity of the picture of an individual patient has become so huge that it’s really not possible to analyse by hand anymore,” Moneymaker says.

Xiaoyan Wang notes that there are several ethical and practical challenges to AI’s deployment in clinical trials. AI models can be biased. Their results can be hard to reproduce. They require large amounts of training data, which could violate patient privacy or create security risks. Researchers might become too dependent on AI. Algorithms can be too complex to understand. “This lack of transparency can be problematic in clinical trials, where understanding how decisions are made is crucial for trust and validation,” she says. A recent review article6 in the International Journal of Surgery states that using AI systems in clinical trials “can’t take into account human faculties like common sense, intuition and medical training”.

Moneymaker says the processes for designing and running clinical trials have often been slow to change, but adds that the FDA has relaxed some of its regulations in the past few years, leading to “a spike of innovation”: decentralized trials and remote monitoring have increased as a result of the pandemic, opening the door for new types of data. That has coincided with an explosion of generative-AI capabilities. “I think we have not even scratched the surface of where generative-AI applicability is going to take us,” she says. “There are problems we couldn’t solve three months ago that we can solve now.”

[ad_2]

Source Article Link
Categories
Life Style

Numbers highlight US dominance in clinical research

[ad_1]

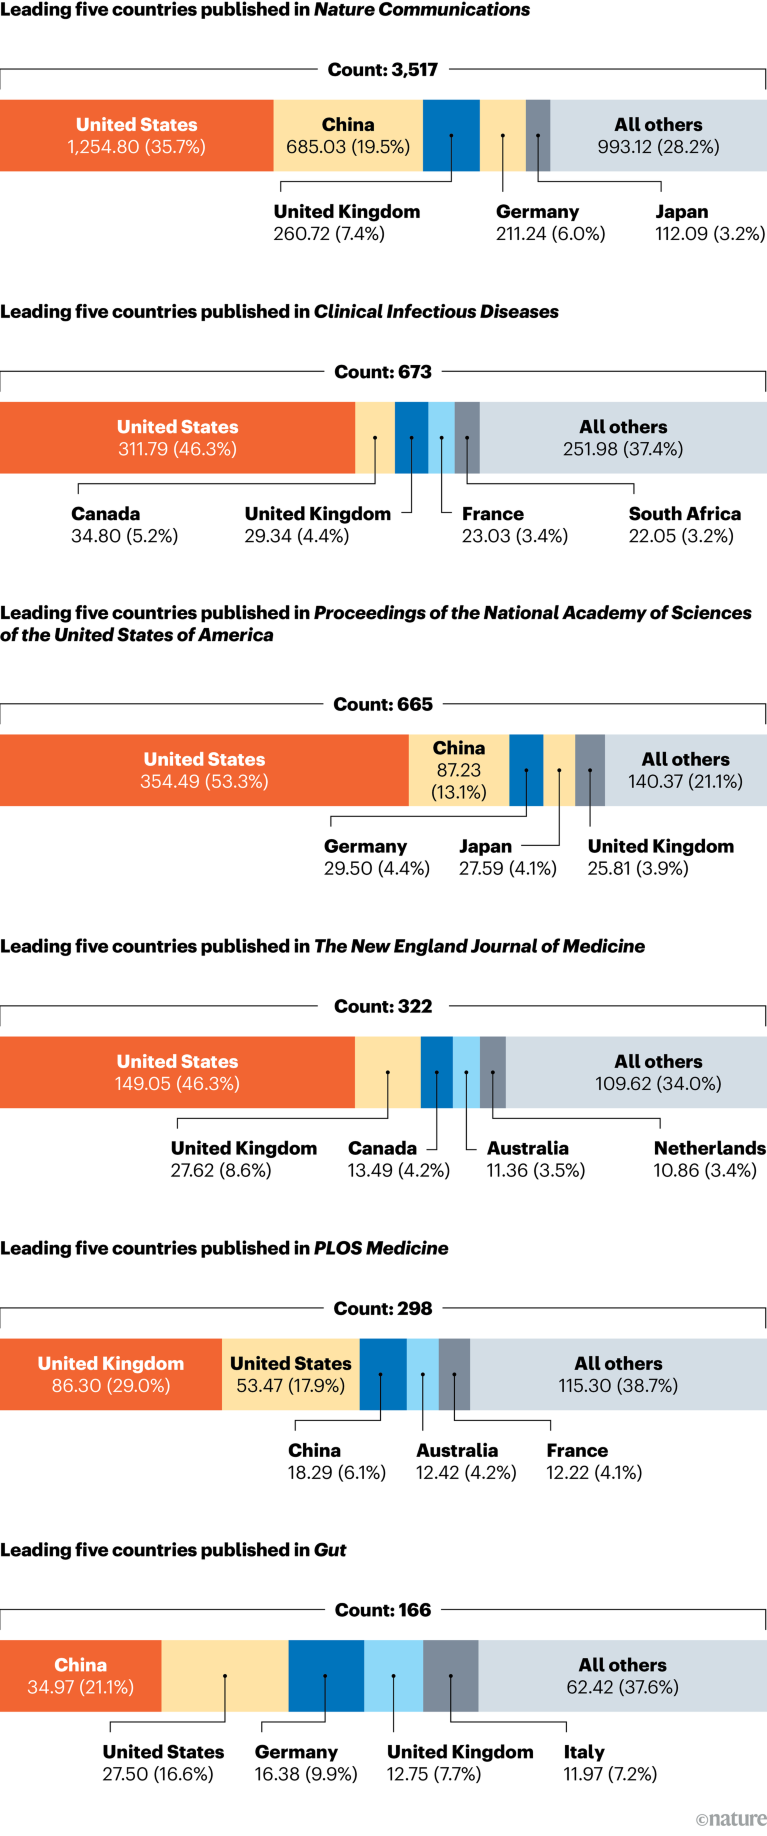
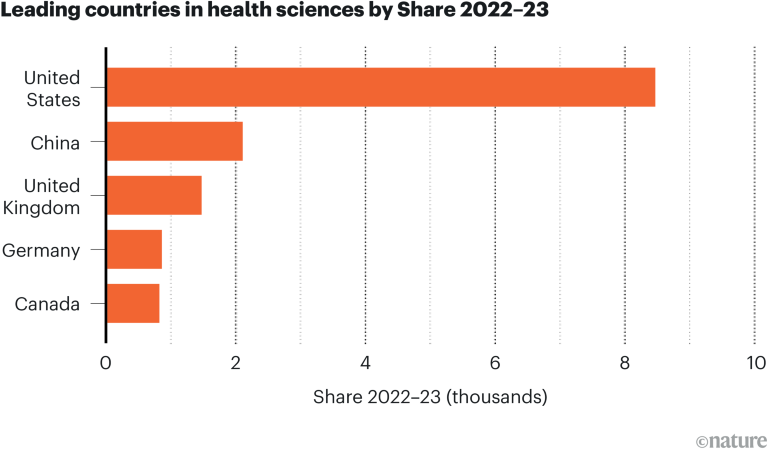
As the leading country in health-sciences output in the Nature Index, the United States’ Share is almost 8,500, higher than the next 10 leading countries combined. As a result, US institutions feature prominently among the leading research organizations for the subject, with 30 of the top 50 being based there.

The country’s dominance means that it comes top for Share in all but seven of the journals tracked by the Nature Index in the subject. This includes large general journals such as Nature Communications and specialist medical publications such as The New England Journal of Medicine. PLOS Medicine and Gut are two examples where authors based elsewhere (the United Kingdom and China) made the largest contribution.

Proportion bar showing the leading five countries' Share and percentage of their contribution to health-sciences articles in 6 journals

Source: Nature Index. Data analysis by Aayush Kagathra. Infographic by Simon Baker, Bec Crew and Tanner Maxwell.

The United States is the clear frontrunner among the leading five countries for health-sciences research, with a Share almost four times higher than China, in second place. The United Kingdom is third, with a Share of almost 1,500, a higher placing than its fourth position overall in the Nature Index.

Bar graph showing the leading countries in health-sciences output by Share in 2022-23 in the Nature Index

Source: Nature Index. Data analysis by Aayush Kagathra. Infographic by Simon Baker, Bec Crew and Tanner Maxwell.

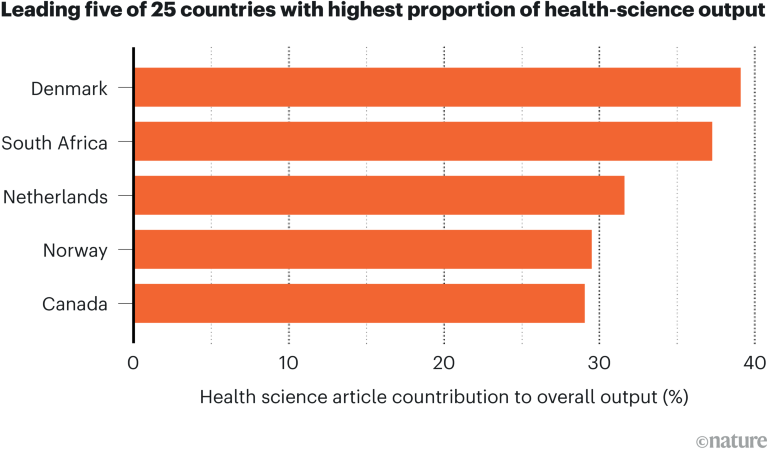
Out of the top 25 countries for health-sciences articles in the Nature Index, five nations have a Share that makes up at least 29% of their overall footprint in the database across all subjects. Denmark, whose research is boosted by the success of companies such as Novo Nordisk, has the highest ratio in this regard at almost 40%.

Bar graph showing five of 25 countries with the highest proportion of health-sciences output in the Nature Index

Source: Nature Index. Data analysis by Aayush Kagathra. Infographic by Simon Baker, Bec Crew and Tanner Maxwell.

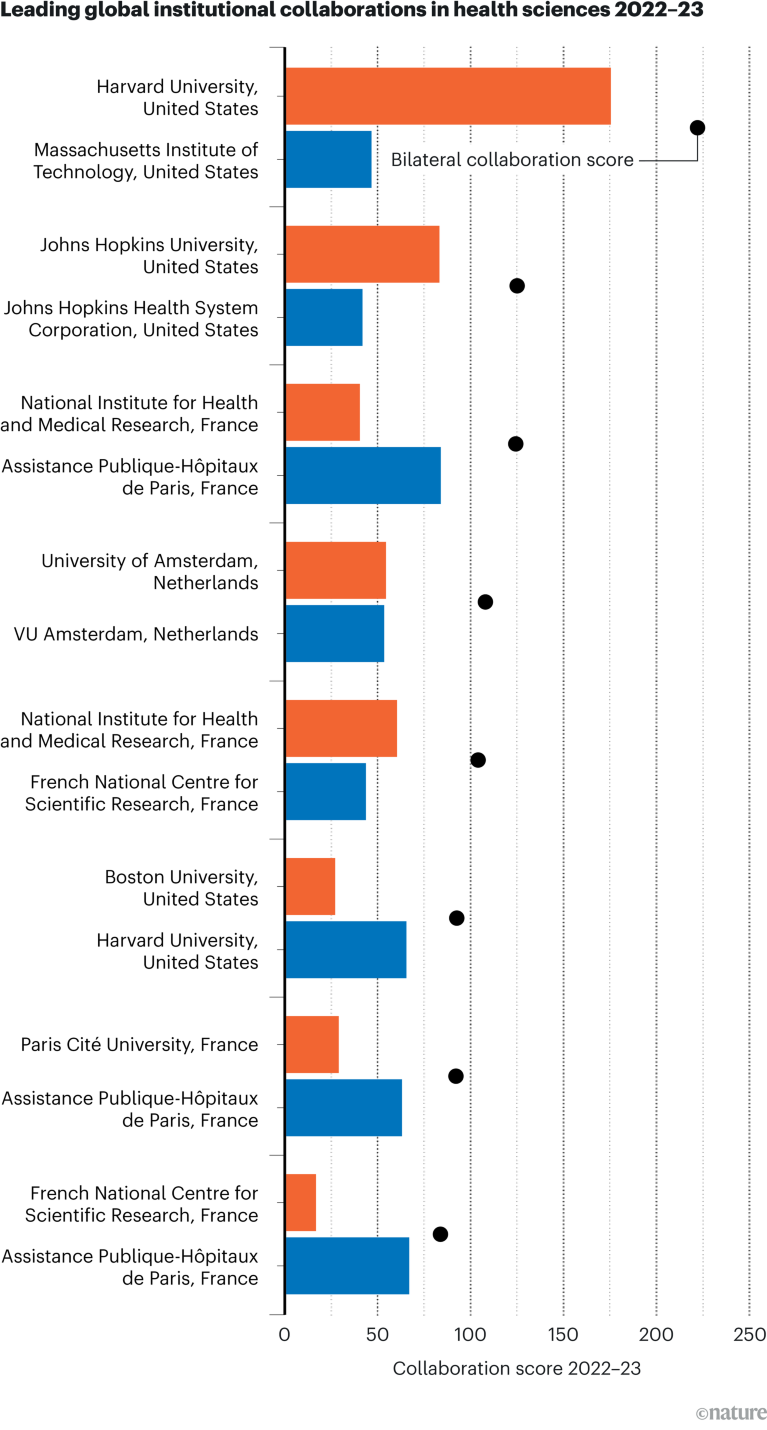
As Harvard University, in Cambridge, Massachusetts, is the leading institution for high-quality health-sciences research, its involvement in the top institutional partnership in the field is no surprise. But its dominance does not extend to all the other leading collaborations, some of which involve institutions outside the United States.

Bar graph showing the leading global institutional collaborations in health sciences in the Nature Index for 2022-23

Source: Nature Index. Data analysis by Aayush Kagathra. Infographic by Simon Baker, Bec Crew and Tanner Maxwell.

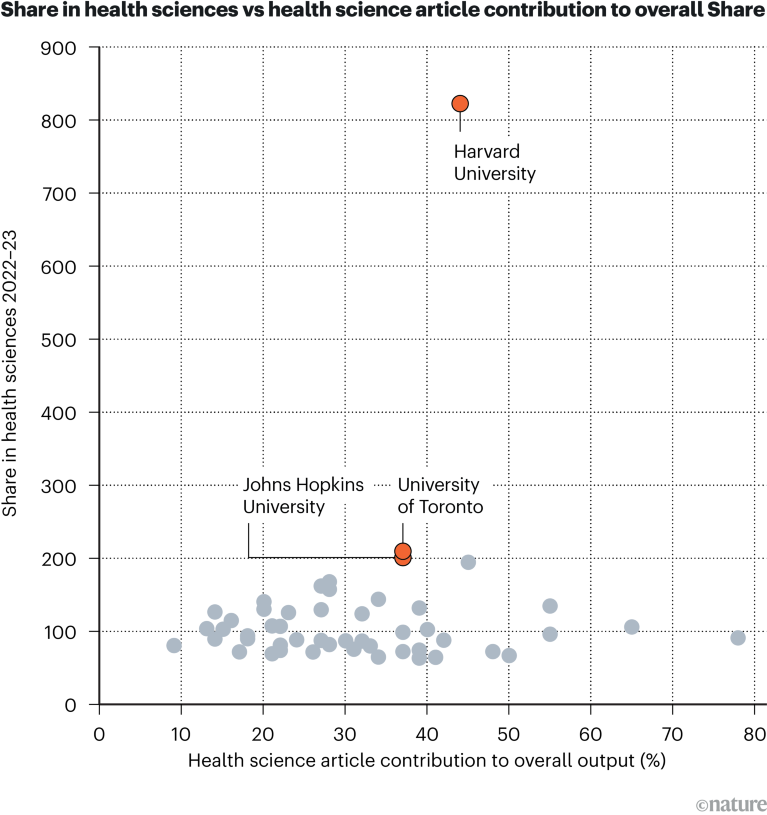
The difference in Nature Index health-sciences output between the leading academic institution, Harvard University in Cambridge, Massachusetts, and other top institutions is a Share of more than 600. Compared with Harvard, most of the leading institutions also have a lower proportion of their overall Nature Index output in health sciences.

The University of Toronto in Canada and Johns Hopkins University in Baltimore, Maryland, are the only other academic institutions with a health-sciences Share of over 200. They also have a relatively strong focus on health sciences, with over 35% of their overall Nature Index research output in the subject area.

Scatter plot showing selected institutions' Share in health sciences vs their health-science article contribution to overall Share in the Nature Index for 2022-23

Source: Nature Index. Data analysis by Aayush Kagathra. Infographic by Simon Baker, Bec Crew and Tanner Maxwell.

[ad_2]

Source Article Link