Researchers have mapped a tiny piece of the human brain in astonishing detail. The resulting cell atlas, which was described today in Science1 and is available online, reveals new patterns of connections between brain cells called neurons, as well as cells that wrap around themselves to form knots, and pairs of neurons that are almost mirror images of each other.
The 3D map covers a volume of about one cubic millimetre, one-millionth of a whole brain, and contains roughly 57,000 cells and 150 million synapses — the connections between neurons. It incorporates a colossal 1.4 petabytes of data. “It’s a little bit humbling,” says Viren Jain, a neuroscientist at Google in Mountain View, California, and a co-author of the paper. “How are we ever going to really come to terms with all this complexity?”
Slivers of brain
The brain fragment was taken from a 45-year-old woman when she underwent surgery to treat her epilepsy. It came from the cortex, a part of the brain involved in learning, problem-solving and processing sensory signals. The sample was immersed in preservatives and stained with heavy metals to make the cells easier to see. Neuroscientist Jeff Lichtman at Harvard University in Cambridge, Massachusetts, and his colleagues then cut the sample into around 5,000 slices — each just 34 nanometres thick — that could be imaged using electron microscopes.
Jain’s team then built artificial-intelligence models that were able to stitch the microscope images together to reconstruct the whole sample in 3D. “I remember this moment, going into the map and looking at one individual synapse from this woman’s brain, and then zooming out into these other millions of pixels,” says Jain. “It felt sort of spiritual.”
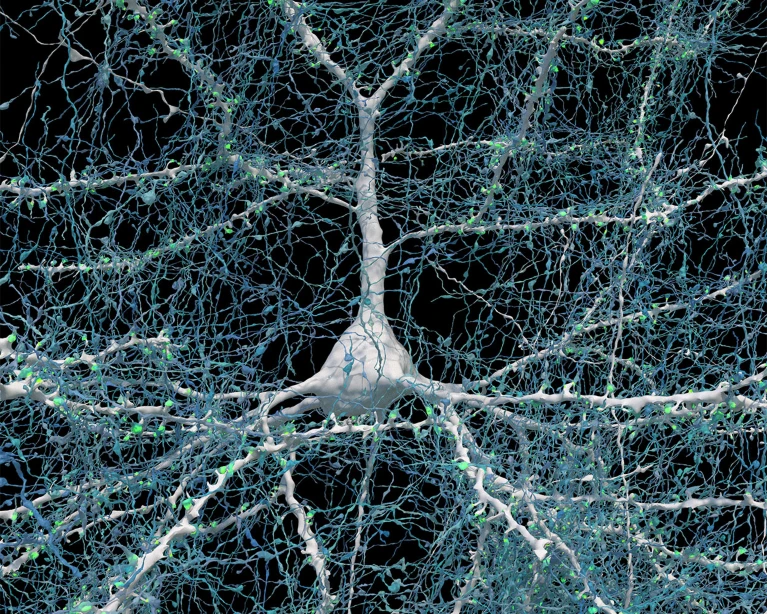
A single neuron (white) shown with 5,600 of the axons (blue) that connect to it. The synapses that make these connections are shown in green.Credit: Google Research & Lichtman Lab (Harvard University). Renderings by D. Berger (Harvard University)
When examining the model in detail, the researchers discovered unconventional neurons, including some that made up to 50 connections with each other. “In general, you would find a couple of connections at most between two neurons,” says Jain. Elsewhere, the model showed neurons with tendrils that formed knots around themselves. “Nobody had seen anything like this before,” Jain adds.
The team also found pairs of neurons that were near-perfect mirror images of each other. “We found two groups that would send their dendrites in two different directions, and sometimes there was a kind of mirror symmetry,” Jain says. It is unclear what role these features have in the brain.
Proofreaders needed
The map is so large that most of it has yet to be manually checked, and it could still contain errors created by the process of stitching so many images together. “Hundreds of cells have been ‘proofread’, but that’s obviously a few per cent of the 50,000 cells in there,” says Jain. He hopes that others will help to proofread parts of the map they are interested in. The team plans to produce similar maps of brain samples from other people — but a map of the entire brain is unlikely in the next few decades, he says.
“This paper is really the tour de force creation of a human cortex data set,” says Hongkui Zeng, director of the Allen Institute for Brain Science in Seattle. The vast amount of data that has been made freely accessible will “allow the community to look deeper into the micro-circuitry in the human cortex”, she adds.
Gaining a deeper understanding of how the cortex works could offer clues about how to treat some psychiatric and neurodegenerative diseases. “This map provides unprecedented details that can unveil new rules of neural connections and help to decipher the inner working of the human brain,” says Yongsoo Kim, a neuroscientist at Pennsylvania State University in Hershey.
An internals-only scan gives you a sense of how much Apple artfully packs into Vision Pro. Photo: Lumafield
Want to see exactly what advanced engineering lies inside a Vision Pro AR/VR headset compared to Meta Vision Quest headsets? Lumafield dropped a fascinating video and a series of CT-scan images Tuesday to show you.
Lumafield pointed out it’s aim is not to present a head-to-head comparison or product review, but to reveal the companies’ “divergent design philosophies” through the headsets’ hardware engineering.
‘Non destructive teardown’ compares Vision Pro to Meta Vision Quest via CT scan
Unlike a traditional tear-down, Lumafield’s scans just show you what’s inside with no deconstruction. Lumafield recently did the same thing to show the inner workings of Apple’s advanced Thunderbolt 4 cable.
“When we look inside the Vision Pro with our CT scans, we can see it’s a product that puts design first,” the video demo noted, indicating details that would make an Apple industrial designer beam with pride.
The presenter went on to say this:
Everything inside the Vision Pro is canted to make the most of the available internal space without detracting from the external contours of the brushed aluminum frame and laminated glass front plate. The main circuit board is built around a flexible PCB ribbon, and electronics are packed in here at different angles.
This is more a comprehensive overview scan of Vision Pro with labeling. Photo: Lumafield
Watch the Lumafield CT scanner video of Vision Pro and Meta Quest headsets:
Call of Duty: Modern Warfare 3 Season 3 is officially live, introducing brand new battle pass content, gameplay improvements, and more.
The full patch notes revealed by Activision detail everything players can expect this season, with the first most notable feature being the addition of six 6v6 multiplayer maps.
Three of these maps are brand-new locales, while the remaining three are “fresh yet familiar experiences”. The Emergency 24/7 playlist can be accessed immediately with the launch of Season 3, and includes the maps Emergency, 6 Star, Tanked, Growhouse, Grime (in-season), and Checkpoint (in-season).
To accompany the new set of maps, players can also dive into four new classic modes, Capture the Flag, One in the Chamber, Minefield (in-season), and Escort (in-season) with more scheduled to arrive later in the season.
(Image credit: Activision / Sledgehammer Games)
There are also a bunch of new weapons this season, four of which can be unlocked through the latest Battle Pass, such as the MORS and BAL-27 from Call of Duty: Advanced Warfare (2014). Alongside additional Aftermarket Parts and equipment, like the EMD Mine and Enhanced Vision Goggles, Sledgehammer Games has confirmed that it has also made some quality-of-life improvements for gunplay by making changes to aiming.
The developer highlighted the update in a separate post, saying that it has “improved clarity while firing MWII weapons and added Initial Aim Accuracy to heavy bolt Attachments on Snipers.” It also noted that ADS Idle Swat is now a predictable motion, “raising the skill ceiling by eliminating randomness and encouraging weapon mastery.”
Season 3 will also see the addition of six new Operators, including rapper Snoop Dogg who has an alternate skin that turns him into a literal dog, along with several new events with limited-time rewards. Zombies mode also has a brand-new story mission called Dark Aether Rift, as well as new challenges to take part in, while Call of Duty: Warzone welcomes the return of the fan-favorite Rebirth Island and a new training mode called Warzone Bootcamp, which can be played against real players and bots.
Get the hottest deals available in your inbox plus news, reviews, opinion, analysis and more from the TechRadar team.
For more details on Warzone‘s season 3 weapon updates and other general adjustments, you can check out the latest patch notes.
The front of the Simons Observatory’s Large Aperture Telescope Receiver, the largest receiver for observing the cosmic microwave background built so far.Credit: Mark Devlin/University of Pennsylvania
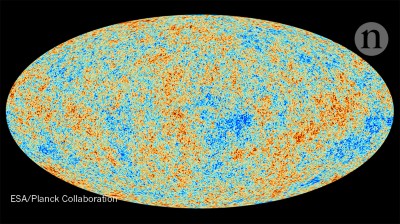
Cosmologists are preparing to cast their sharpest-ever eyes on the early Universe. From an altitude of 5,300 metres on Cerro Toco, in northern Chile’s Atacama Desert, the Simons Observatory will map the cosmic microwave background (CMB) — sometimes called the afterglow of the Big Bang — with a sensitivity up to ten times greater than that of the previous gold standard, Europe’s Planck space probe.
“It will be the best view of the CMB that we’ve ever had,” says Jo Dunkley, a cosmologist at Princeton University in New Jersey and one of the leading researchers in the observatory’s team. Construction of the US$109.5-million observatory is due to be completed in a matter of weeks.
Big Bang telescope finale marks end of an era in cosmology
One of the project’s goals is to find fingerprints left in the CMB by gravitational waves that originated from the Big Bang itself. These would provide the first incontrovertible evidence for cosmic inflation, a brief moment in which expansion is thought to have proceeded at an exponential rate. During that time, quantum fluctuations on a microscopic scale are thought to have seeded the Universe with what became its large-scale structure — including the current distribution of clusters of galaxies across space.
The scientific collaboration is led by five US universities and the Lawrence Berkeley National Laboratory in Berkeley, California. The project is named after Jim Simons, a mathematician, billionaire hedge-fund investor and philanthropist, and his wife Marilyn. The Simons Foundation in New York City contributed grants of around $90 million to build the observatory.
Once construction is complete, engineers will begin the months-long processof fine-tuning and testing the observatory’s instruments before its science programme can fully begin.
Signs of inflation
The Simons Observatory is an array of four telescopes. Three are identical 0.4-metre small aperture telescopes (SATs) and one is the 6-metre Large Aperture Telescope (LAT). Together, they will map minuscule variations in the temperature of the CMB from one patch of the sky to the next, as well as the CMB’s polarization, which is a preferential direction in which the radiation’s electric fields wiggle as the microwaves propagate through space.
China’s mountain observatory begins hunt for origins of cosmic rays
The three SATs will concentrate on a patch covering 20% of the southern sky. The aim is for them to study large-scale swirls — spanning an area several times the apparent size of the Moon in the sky — in the polarization field of the CMB. (Polarization maps look like arrays of sticks, and the orientations of the sticks can form specific swirling patterns called vortices.) It is here that the signals of cosmic inflation, known as B-mode patterns, are expected to show up.
Many cosmologists see inflation as the most plausible mechanism for the process that gave the Universe its structure, caused by an energy field called the inflaton. The nature and properties of the inflaton are mysterious. Many theories have been proposed, predicting gravitational-wave signatures of a wide range of intensities.
It is therefore not guaranteed that the signal, if it exists, is strong enough for the Simons Observatory to see it, says Suzanne Staggs, another Princeton cosmologist who is the observatory’s co-director. “But oh my gosh — if they were right there, it would be amazing.”
The Simons Observatory site photographed from the side of Cerro Toco in the Atacama Desert, Chile.Credit: Mark Devlin/University of Pennsylvania
The known physics of quantum fields suggests that the signatures should be within theSimons Observatory’s sensitivity range, or close to it, says Marc Kamionkowski, a theoretical astrophysicist at Johns Hopkins University in Baltimore, Maryland, who was among the first researchers to predict the existence of B-mode patterns in 19971,2.
While the SATs focus on a relatively small area, the LAT will map 40% of the sky, at much finer resolution, and record temperature fluctuations in the CMB, as well as the CMB’s polarization. Cosmologists working on Planck and other past CMB projects have been able to extract troves of information by plotting the intensity of those temperature fluctuations against the area of sky that they span. Such graphs enabled cosmologists to produce precise estimates of both the Universe’s age (13.8 billion years) and its composition (only around 4% of which is ordinary matter).
The LAT data could help researchers to detect signals of cosmic inflation in low-resolution polarization maps made by the smaller telescopes. In particular, they will be crucial for separating that pattern from spurious signals produced by effects such as dust in the Milky Way, explains Mark Devlin, a cosmologist at the University of Pennsylvania in Philadelphia who is co-director of the observatory. The experiment will be six times more sensitive to the polarization patterns than any previous attempts3 to measure them.
Exploring unknowns
However, searching for signals of inflation is only one of the project’s goals: the Simons team plans to get much more science from the observatory’s high-resolution map of the CMB. It will enable researchers not only to visualize the Universe at an early age, but also to study how its primordial radiation was affected during the 13.8 billion years it spent travelling in space, before it got to Earth.
In particular, the CMB is diverted by the gravity of large clumps of galaxies and dark matter — a phenomenon known as gravitational lensing — and this can be exploited to produce 3D maps of those clusters. Devlin, Staggs and their collaborators pioneered this technique with an earlier high-precision CMB project called the Atacama Cosmology Telescope, which was in operation from 2007 to 2022, also at Cerro Toco, and has yet to publish its final results. The Simons team will reconstruct the gravitational lensing experienced by the CMB, and determine how much of this is due to the Universe’s neutrinos. This will enable them to calculate the mass of these particles, which is still unknown. “It is a guaranteed signal,” says Brian Keating, an astrophysicist at the University of California, San Diego, who is the project’s principal investigator.
Physicists Anna Kofman and Simon Dicker at the University of Pennsylvania in Philadelphia work on the dilution refrigerator inside the Large Aperture Telescope Receiver.Credit: Mark Devlin/University of Pennsylvania
Because the LAT will be scanning the same regions of sky repeatedly over its lifetime, it will also be able to track the motion of asteroids in the Solar System and monitor active black holes at the centres of other galaxies — and how their output changes over time. “We’re going to be able to track 20,000 or more active galactic nuclei, which are, we think, supermassive black holes with jets,” Dunkley says.
Ambitious follow-up
The observatory will have two runs, each lasting about four years, with a planned $53-million upgrade in between. An even more ambitious project called CMB-S4, to be led by the US Department of Energy and the National Science Foundation, is planned as a follow-up, with observations beginning in the mid-2030s. With telescopes at both Cerro Toco and the South Pole, the $800-million array will improve sensitivity to the inflationary signal by another factor of six.
It is hoped that some of the Simons Observatory’s hardware could be reused as part of the CMB-S4, although the details have not yet been ironed out, says John Carlstrom, an astrophysicist at the University of Chicago in Illinois who is project scientist for the CMB-S4 collaboration.
In 2014, a team working on a CMB experiment at the South Pole called BICEP2 made a bold claim to have detected the inflationary signature, but later retracted it when it became clear that what they were seeing was galactic dust. Since then, direct detection of gravitational waves — coming not from the Big Bang, but from astrophysical phenomena such as pairs of black holes merging — has become routine. Cosmologists are excited to get another chance to spot the primordial signals. “We’re talking about 13.8 billion years ago, with energy densities 15 orders of magnitude larger than anything we can create in the lab,” says Kamionkowski. “It’s kind of remarkable that we can even talk about this.”
Samsung has released a video showing off some of the features of the Samsung Net Zero Home, which is located at Brobyholm smart city near Stockholm, Sweden, Samsung is also developing these homes in other countries including the USA and South Korea.
The video below from Samsung gives us a look at the wide range of devices that have transformed this house into a Net Zero Home, let’s find out some more details about the house.
As soon as the sun rises in the morning, an energy-efficient home begins producing and storing energy using advanced solar panels and storage batteries. On clear, sunny days, the smart home system switches on the air conditioning or heating in advance — to save energy later on in the day, once the sun sets or the weather becomes overcast.
Using Samsung’s integrated and expansive multi-device ecosystem SmartThings, users can seamlessly control their home appliances and smart home devices. AI Energy Mode on SmartThings Energy helps users effortlessly save energy throughout their home by automatically optimizing energy usage of appliances.
You can find out more information about the Samsung Net Zero Home over at Samsung’s website at the link below, we are looking forward to seeing how this is developed in the future.
Source Samsung
Filed Under: Technology News, Top News
Latest timeswonderful Deals
Disclosure: Some of our articles include affiliate links. If you buy something through one of these links, timeswonderful may earn an affiliate commission. Learn about our Disclosure Policy.